Bitcoin at $76.5K: the price is the least interesting thing on this chart
$BTC 76.5k. The price is the least interesting thing on this chart.
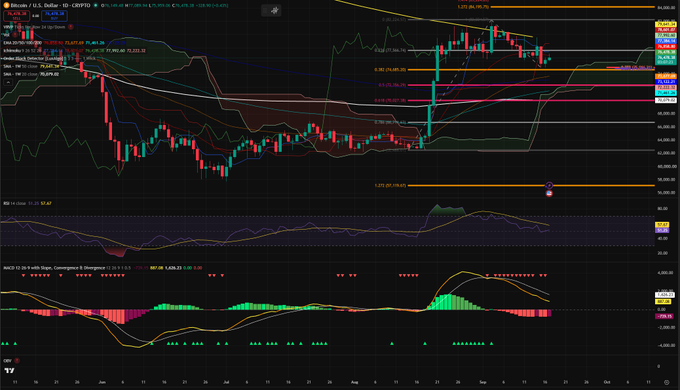
The 50 week SMA is falling about 1,000 a week. The Ichimoku cloud is rising into price from underneath.
They converge Oct 9 to 16. Right where price is standing.
So the 50 week isn’t a wall waiting to be broken. It’s a level walking down to meet price.
If BTC does nothing and just chops 75 to 78k for a month, it ends up above the 50 week by mid October without a single green week that mattered.
It already took one swing at it. Sep 14 high came within $100 of the 50 week and got refused. Next day it gave back 3.2%.
But it only fell to 75k and stopped. That’s the 0.382 of the August leg.
Shallow retrace after a vertical breakout is continuation behavior.
3 potential paths:
Path 1, up.
Daily close over 77.7k, then 78.6k which is also the Kijun. Fight at 79.5 to 79.7k where the 50 week sits. Through that, 82.3k is the high.
Gets easier every week the 50 week drops.
Path 2, nothing happens.
Chop 75 to 78.6k and the wedge closes itself. This is where I’d put most of the weight. Whatever comes out of that apex moves fast.
Path 3, down.
Lose 75k 73.2 to 73.7k (50 and 200 EMA) → 72.3k. That one is the line. Below it price is back inside the cloud and the structure is gone. Then 70.1k, the 20 week.
Bullish? Yes but chart needs more confirmation.
Price is under a falling 50 week and the 20 week is 12% below it. That’s repair work, not yet a “bull market.” Confirmation is a weekly close over 79.7k.